Moneyball #2: Finding Value at the Yearling Sales
For some strange reason I still can’t let go of the Moneyball analogy, even though it’s such a lazy cliché these days. Perhaps it’s because both the book and the film are so bloody good, or that the underlying philosophy of constantly searching for new methods to evaluate performance in sports is so compelling.
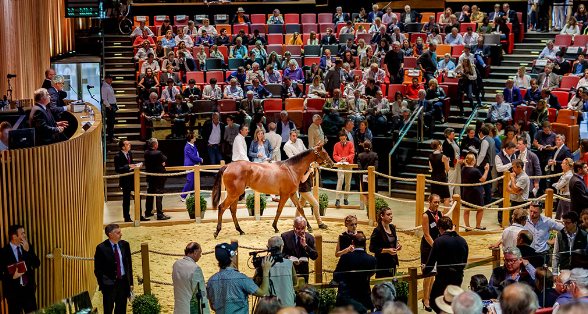
With the European Yearling Sales season approaching, it’s time for another sales piece, albeit veering into overall philosophy on how to approach buying racehorses.

Metrics
In order to identify where to find value, it’s important to first understand the baseline characteristics of the market that we play in. We use pretty standard metrics to summarise the overall performance of the market, but recently I’ve started deriving performance metrics based on spend which can offer some useful insight.
Generally across the market we’re looking at performance from the following factors:
· Number of Lots / Hips offered
· % Raced = ratio of horses that reached the track from lots offered
· %Winners = ratio of winners from lots offered
· %Stakes Winners = ratio of stakes winners from lots offered
· %Group Winners = ratio of group winners from lots offered
· Price Paid per Winner (PPW)
· Price Paid per Stakes Winner (PPSW)
A bit on PPW and PPSW then. We calculate the price paid per winner by taking the total amount spent on horses and dividing it by the number of winners returned from that spend. For example, a buyer purchases 10 horses at a value of £50k each, 500k total. They return 4 winners from those 10 purchases, giving them a price paid per winner of £500k/4 or £125k spent per winner. That same logic applies for price paid per stakes winner.
The Market
Before we play the game, we first must understand the game that we play. Prior to starting our analysis of comparative performance of different sales, vendors and purchasers i’d like to understand the market baselines that they are working against. The below table shows a breakdown per country of yearlings sold since 2015 and the subsequent racing records of those in terms of %Raced, % Winners, % Stakes Winners, % Group Winners and % Group 1 Winners.
Globally 73.17% of yearlings offered at sales made the track as a racehorse, 46.57% of yearlings offered achieved a win on the track, 2.74% won a stakes race, 1.26% won a Group race and a super-elite proportion of 0.31% of yearlings offered through the ring won a Group 1 race. Across the major racing jurisdictions globally, here’s the breakdown.
You’ll notice the comparatively higher % of yearlings winning a stakes race in New Zealand and Germany. This is because the volume of racehorses vs. available stakes races in the country are lower vs. other jurisdictions. Put simply, it’s easier to win a stakes race in New Zealand or Germany than it is in other countries. For this reason we apply a “country factor” to rate performances of stallion progeny in our pedigree modeling, but more on that another time…
Japan & Ireland are the toughest countries from which to attain a stakes winner, due to the competitiveness of the racing there & lower ratio of available stakes races available to the racehorse population. When you see Japanese or Irish blacktype form you can give it a strength boost.
For reference in terms of the financials, the return (money spent) to purchase a stakes winner (across all purchases) is £1.93m GBP and the return to purchase a group winner (across all purchases) is £3.30m GBP. More on this later.
Sales Strength or “Gone Fishing”
Imagine the purchaser of yearlings as a fisherman; waders, big floppy hat, camo outfit to disguise themselves from fish even though they’re in water. Well, an analogy I often use regarding yearling sales is that if we want to give ourselves the best chance of finding good horses then it’s very important to go fishing in the best pools ! That’s where sales strength as a factor comes in. Not all sales are greatly equal. Sales companies are very adept at pre evaluating stock to send to a sale and consignors are experts in terms of placing their young horses to best maximize returns.
The top 3 sales statistically across Europe in terms of the production factor of stakes and group winners would be pretty well known. You might not have the exact figures to hand, but we know them inherently.
Since 2015:
- Tatts Book 1–3373 lots offered, 227 stakes winners (6.73%), 137 Group Winners (4.06%)
- Arqana August — 2699 lots offered, 162 stakes winners (6.00%), 84 Group winners (3.11%)
- Goffs Orby — 3393 offered, 150 stakes winners (4.42%), 71 Group winners (2.09%)
These are the best pools from whence to go fishing in Europe.
That said, at these pools competition is fierce, there are many other fishermen with bigger rods than ourselves. They may produce the higher proportion of stakes and group winners, but the outlay to get them is much higher than comparative sales grounds.
In terms of price per stakes winner, the best value across Europe can be found at the Tattersalls Sommerville Yearling Sale (formerly September Yearling Sale), where the total outlay to find a stakes winner returned at £661,289. A total of 57 stakes winners found from 2323 yearlings offered, at a stakes winner to offered ratio of 2.45%. Compare that to Tatts Book 1, where the outlay per stakes winner was £3.30m. The haystack might be much larger at the sales like the Sommerville sale, the needles much smaller to find. But when you eventually find them you’ve got more change left over than when you play with the big fish.
The Goffs Premier Yearling Sale at Doncaster in August came out second in terms of value on our spend per stakes winner metric, returning a stakes winner every £701,948 of spend outlayed.
This is the dilemma for prospective buyers; fish in the glorious lakes where there be sharks, or rummage around in the smaller pools where you might just hook a Pearl.
Nurseries or “A Good Hotel”
Vendor analytics are a bit of an untapped edge in my opinion. Perhaps everyone is doing it, but rarely does it seep out into the public domain. Put simply, it helps when yearlings come from a good hotel. The influence of sourcing from a nursery that is able to prepare and educate young horses effectively is a fundamental factor in future racecourse success.
Which is the best hotel in Europe then ?
Gestut Karlshof are the top performing farm in Europe on our metrics, returning 14 stakes winners from 107 yearlings offered since 2015 at 13.08%. Karlshof also came out top on our price paid per stakes winner metric, with an average outlay of £207,805 to get a stakes winner returned from their horses.

Of the larger operations, Normandie based Ecurie de Monceaux stands as a leading light across the continent. 471 yearlings offered, 36 stakes winners (7.64%), 22 Group winners (4.67%), 9 Group 1 winners since 2015. Famous graduates including Paddington (St James Palace Winner), Sottsass (Arc Winner) and Feed The Flame (Grand Prix de Paris Winner).
There are plenty of other fine establishments to mention; New England Stud — 5.22% SW, Haras de Grandcamp — 5.26% SW, Ballyphilip Stud — 7.52% SW, Watership Down Stud — 5.04% SW and 1.83% GW, Newsells Park Stud — 4.62% SW and 2.08% GW.

Judges
We come then to the best purchasers of yearlings across the continent. It’s an interesting one again to evaluate, as do we judge success via the highest % of stakes winners or % Group winners sourced or by the value in which those horses were found? Well for the hell of it, let’s do both.
MV Magnier, of the Magnier racing dynasty, tops the table in terms of % stakes winner return since 2015; 91 purchases, 21 stakes winners (23.08%), 20 Group Winners (21.98%) and 5 Group 1 winners. MV outlayed £43.03m GBP on my numbers for that return, giving him a PPSW of £2.04m and PPGW of £2.15m. I found it quite remarkable the closeness in ratio of stakes level horses to group horses, when MV gets it right they usually turn out to be very good.
In second position is a buyer totally at the other end of the scale, but similarly hailing from a racing dynasty — Alduino Botti, father of trainer Marco Botti. 64 yearlings sourced since 2015, 12 stakes winners (18.75%), 4 Group winners (6.25%), 0 Group 1 winners. What places Botti at the polar end of the scale to MV is the price he spent to find those stakes winners; £975k in total, a PPSW of £81k and PPGW of £243k. You can crab the strength of the wins perhaps, with most coming in Italian racing which wouldn’t be the strongest. But it’s still a remarkable achievement nonetheless.
Here’s the rest of the top of the chart for good measure.
Now for the sales pitch…
In 2022 our company racing² evaluated the biomechanics and kinematic ability of every yearling with a sales video across each European Yearling sale. To date based on racecourse results this season our results stand at 7.84% of stakes winners from our top rated selections; 4 stakes winners returned from 51 elite rated horses that have subsequently raced in the UK and Ireland.
Our return in terms of spend per stakes winner stands at £674k, compare that to the £1.93m market average outlined above. In comparison the bottom rated group of horses that we evaluated return 0.74% stakes winners from the group and you’d have to spend £10.8m before you get to a stakes winner from that pool of horses (270 rated). (>90% rated band below are our top rated horses)
If you like the approach laid out in the article above and would be interested in hearing more then drop us a line at racingsquared@gmail.com. We’ll be covering all yearling sales across Europe and North America this year.